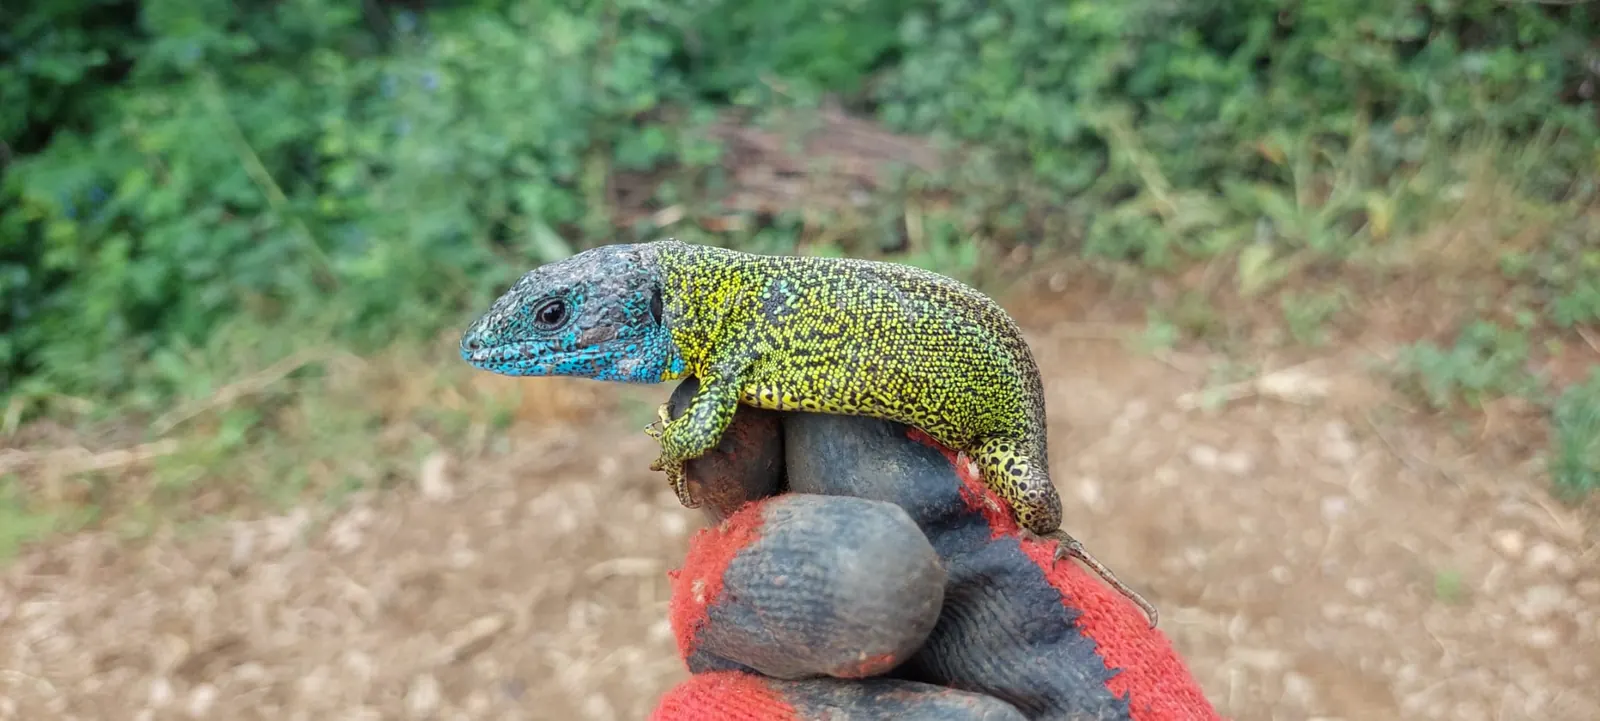
It started with a simple question: where are the species?
A biology degree at Coimbra, summers with the civil-protection authority in Castelo Branco, and a growing suspicion that the interesting problems were spatial.
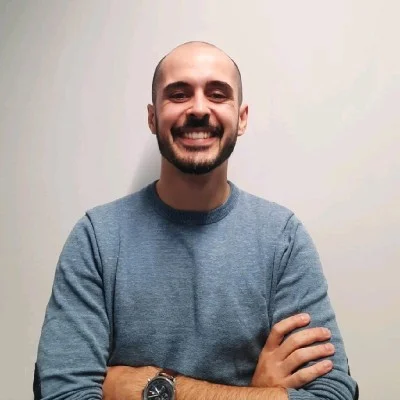
Geospatial data scientist · Castelo Branco, Portugal
Geospatial intelligenceEnvironmental data science
I turn Earth observation, biodiversity models and operational data into intelligence people can act on — from satellite time-series and species forecasts to dashboards a forestry crew uses every morning.
From a biology student who wanted to know where species live to the person who builds the tools that decide what to do about it.
A biology degree at Coimbra, summers with the civil-protection authority in Castelo Branco, and a growing suspicion that the interesting problems were spatial.
For the MontObEO project and my MSc thesis I compiled every available record for the Montesinho/Nogueira SAC, modelled the main taxonomic groups from satellite data in Google Earth Engine, and built an R Shiny WebGIS that ICNF, municipalities and local actors still use.
1,312species mapped in the WebGIS
The biodiversity platform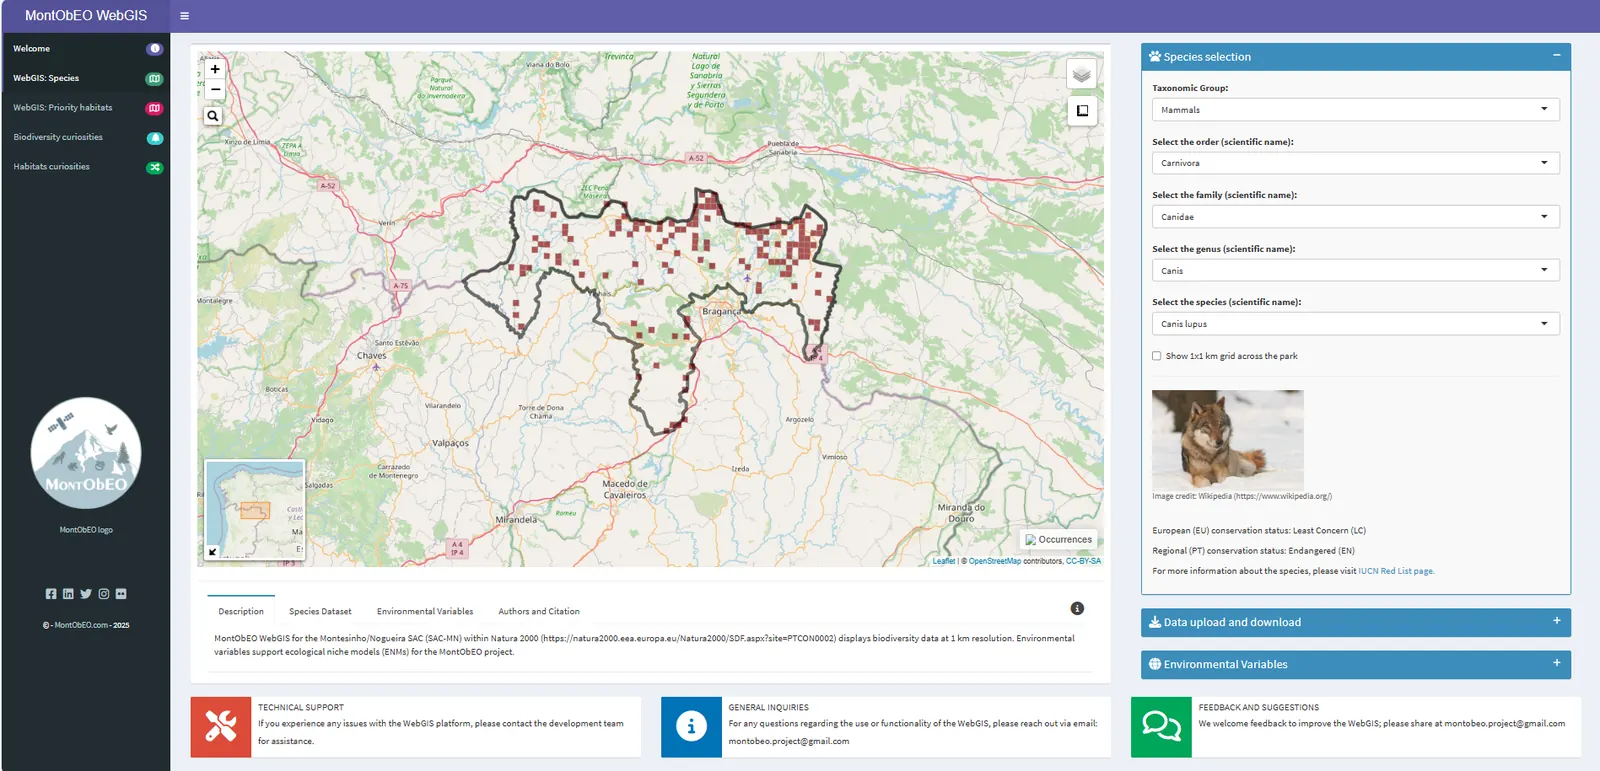
As lead author, I turned satellite time-series into yearly niche models and asked whether species richness had been rising or falling since 2001. It had — in different directions in different parts of the park, and differently for each group.
10,190species records behind the models
Reading habitat change from orbit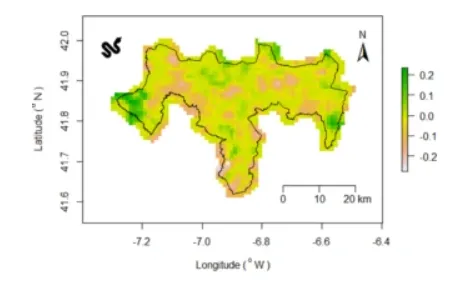
At VU Amsterdam I worked on nested species distribution models for more than ten thousand species and CLUMondo land-use scenarios at one kilometre, feeding biodiversity forecasts for the NaturaConnect consortium and the Swiss Re Foundation. Along the way, a Google Earth Engine app made a One Earth finding explorable by anyone.
10,000+species in the modelling framework
Forecasting biodiversity futures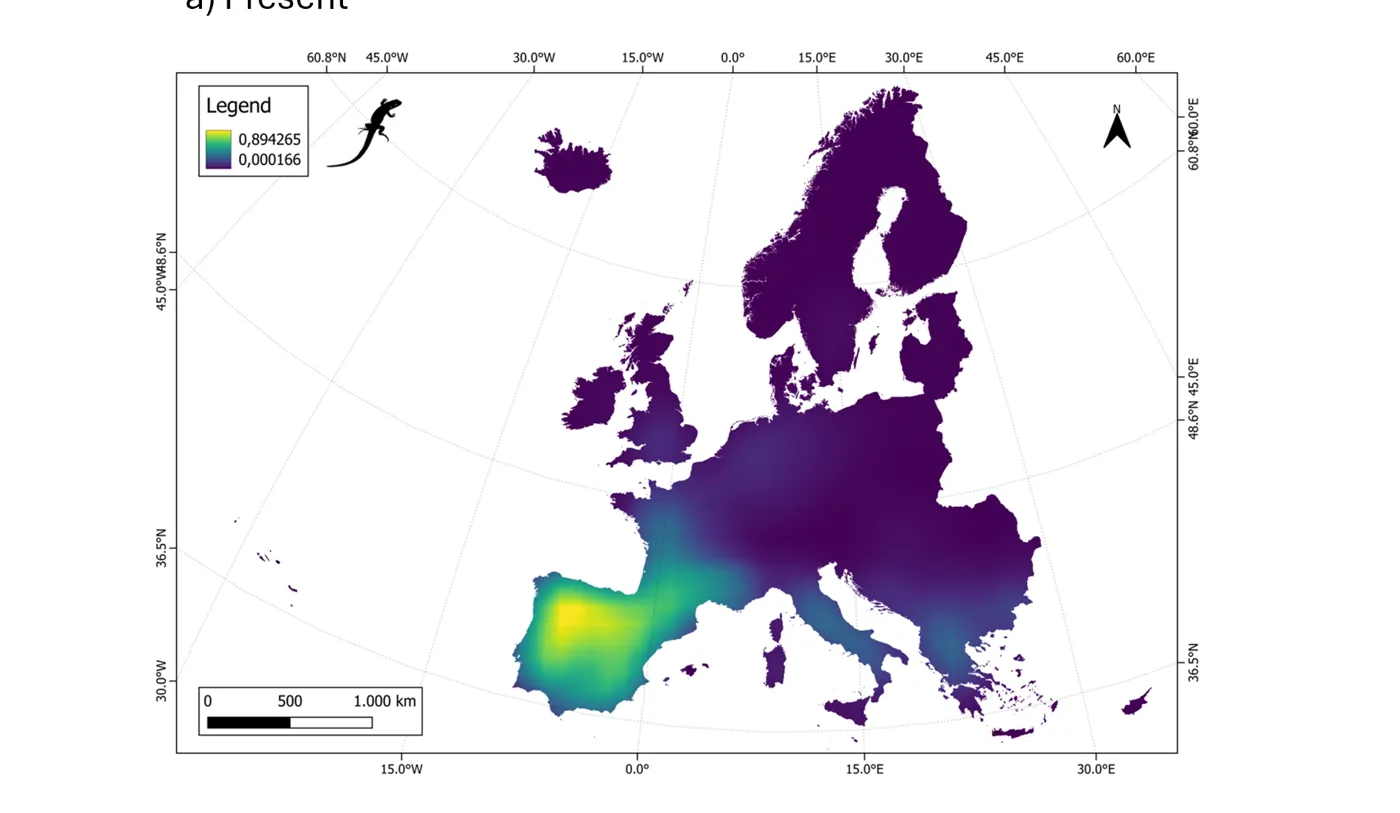
Back in Portugal, the question changed from what will happen to what do we do tomorrow morning. Manual mapping became GIS workflows, spreadsheets became dashboards, and the work-order process got a template, an approval flow and a live view.
~40%less manual mapping time
GIS to operational intelligenceI evaluate AI-generated environmental-management content for Labelbox/Alignerr, finished a business-management postgraduate at ISCTE, and take on problems where geospatial data has to become a decision. If you have one of those, let’s talk.
Start a conversation Described by what you get, not by the software. If your organisation has spatial or environmental data and a decision that depends on it, one of these is probably the shape of the job.
Fragmented geographic data becomes operational maps, WebGIS and dashboards your team actually opens.
Montesinho WebGIS · forestry dashboardsThe satellite archive becomes monitoring: land cover, vegetation and change over twenty years, in the cloud.
Habitat trends 2001–2021 · MontrendsSpecies, climate and land use become scenarios you can compare and defend.
10,000+ species · CLUMondo at 1 kmAnalysis becomes a tool — a scenario explorer, a predictive dashboard, an AI workflow with a specialist in the loop.
ODT workflow · AI evaluationIf you're working with geospatial data, environmental systems, Earth observation, predictive analytics or decision-support technology, I'd like to hear about the problem — not the job title.
Open to selected opportunities
nunogarcia8@gmail.com · Castelo Branco, Portugal · Europe/Lisbon