Work / 01
Forecasting biodiversity futures
Where European species go under climate and land-use change
- Organisation
- Vrije Universiteit Amsterdam
- Role
- Junior Researcher
- Years
- 2023–2025
- Location
- Amsterdam, Netherlands
52.334° N · 4.866° E - Scale
- continent
Challenge
Policy needs to know which development pathways are friendly to both biodiversity and people — but climate, land use and socioeconomics change together, at different scales, and species respond to all of them. The Swiss Re Foundation modelling challenge and the NaturaConnect project both asked for defensible, spatially explicit answers.
Data
- Global and European species occurrence datasets for amphibians, birds, mammals, reptiles and butterflies (10,000+ species)
- Climate projections under multiple RCPs
- European Shared Socioeconomic Pathways (SSPs) and economic-model outputs
- Nature Futures Framework storylines (NaturaConnect Task 5.1)
Intelligence
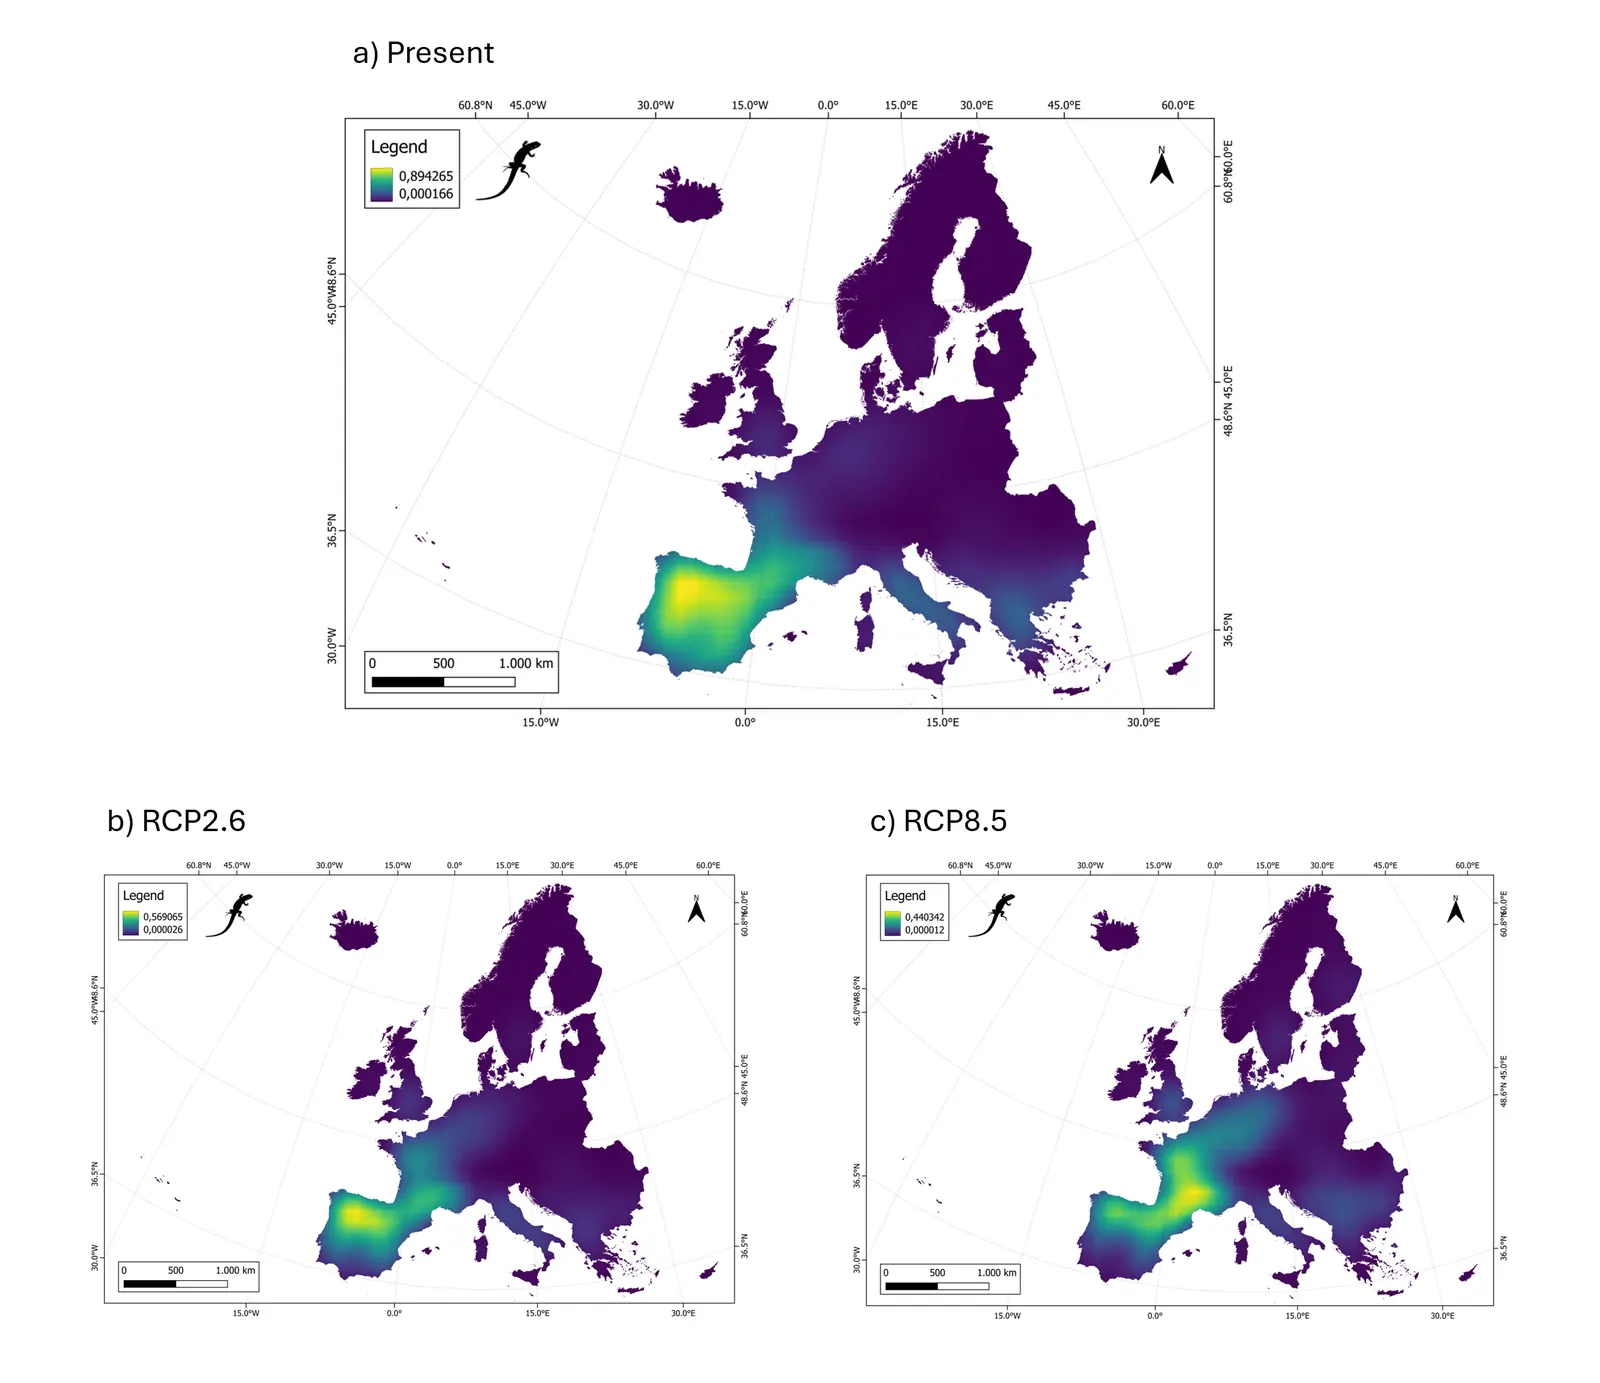
- Nested Species Distribution Models (N-SDMs) combining global and European data so each species is modelled at the scale where its data are strongest
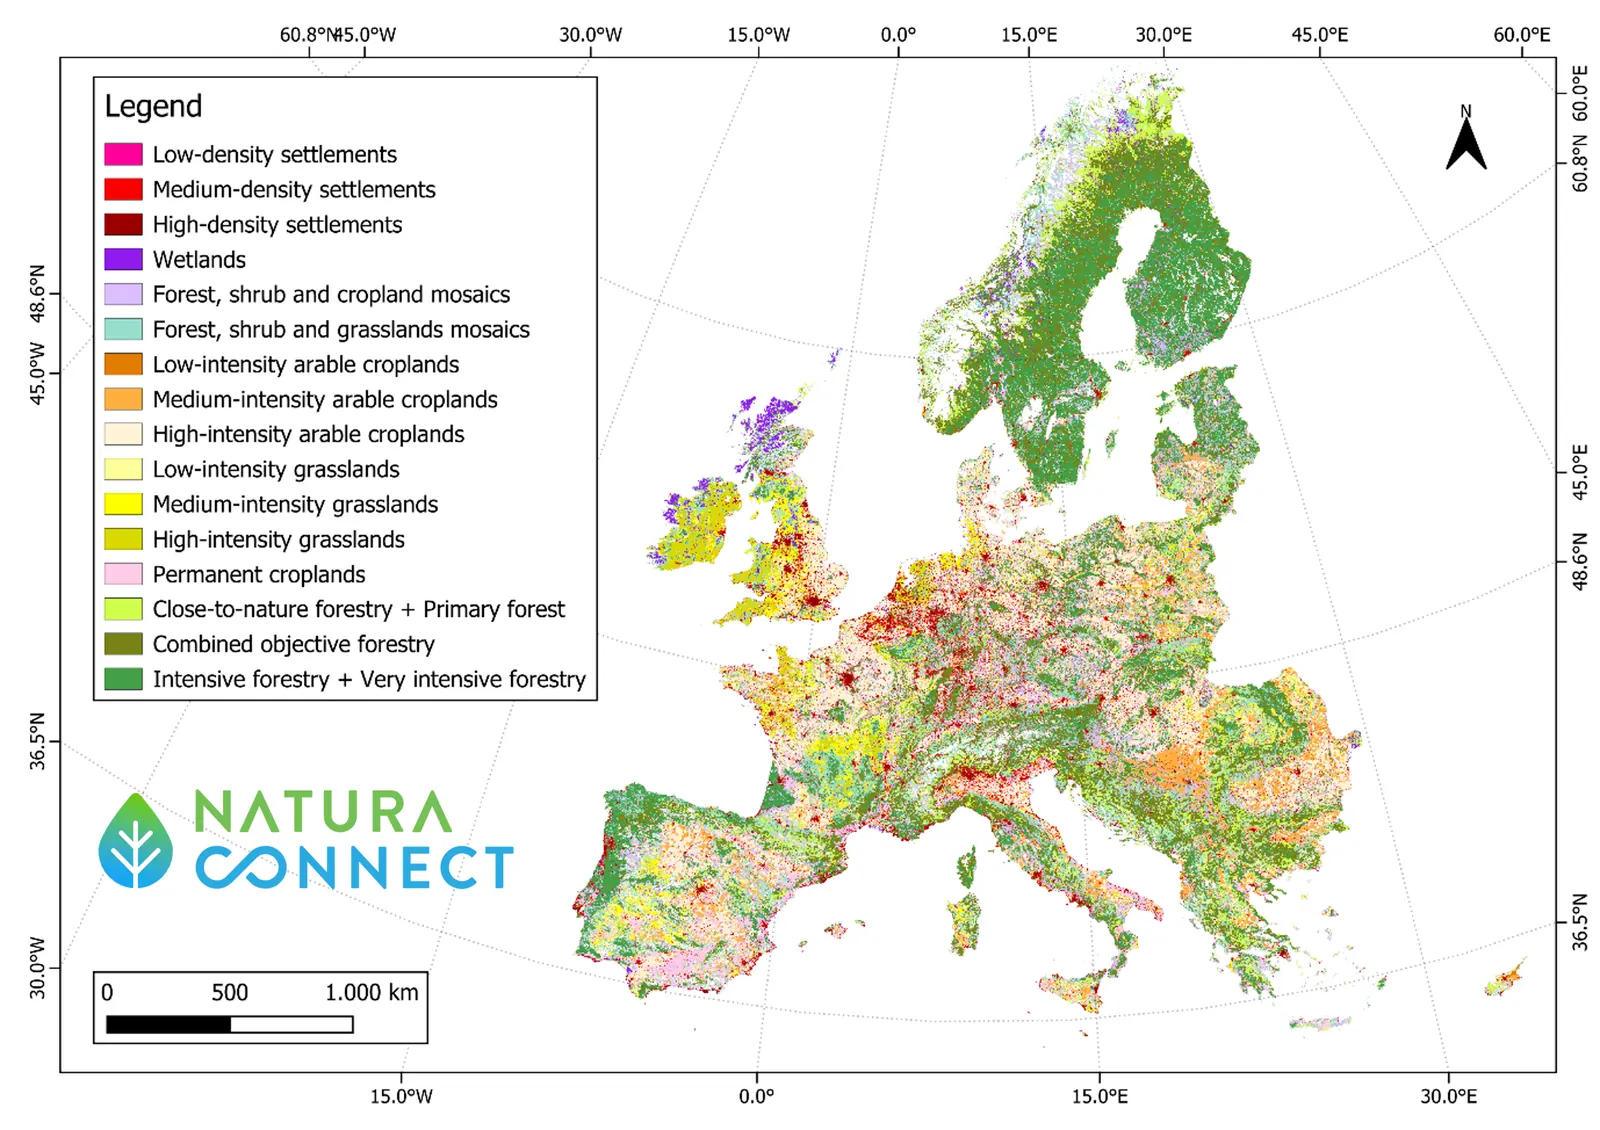
- Land-use scenarios allocated with CLUMondo at 1 km for Europe, parametrised from economic modelling and SSP scenarios
- Species distribution and risk maps per scenario, plus trade-offs between conservation, socioeconomic priorities and ecosystem-service access
Technology
- R
- CLUMondo
- Species Distribution Models
- GEE
- Climate & SSP scenarios
- Spatial statistics
Outcome
- Biodiversity forecasts spanning continental to regional scales across Europe
- An operational multi-scenario framework linking climate, land-use and socioeconomic change
- Land-use model outputs published openly on Zenodo for the NaturaConnect consortium
- Part of the VU project selected in the Swiss Re Foundation biodiversity & ecosystem-services scenarios modelling challenge (2023)
Why it was hard
Three systems move at once. Climate pathways set the envelope; land-use allocation decides where agriculture, forestry and cities expand inside it; and every species reads that landscape differently. A model that is right about one of these and silent about the others gives planners a false precision.
The nested SDM approach solved a data problem, not just a modelling one: European datasets are dense but partial, global datasets are complete but coarse. Combining them per species kept the strongest signal at every scale.
What it changed
Instead of a single “business as usual” map, decision-makers could compare pathways side by side and see where biodiversity loss is a consequence of a choice rather than an inevitability.
Visual evidence