Work / 03
Reading twenty years of habitat change from orbit
Satellite time-series turned into species richness and habitat trends
- Organisation
- MontObEO · University of Porto
- Role
- Lead author
- Years
- 2021–2025
- Location
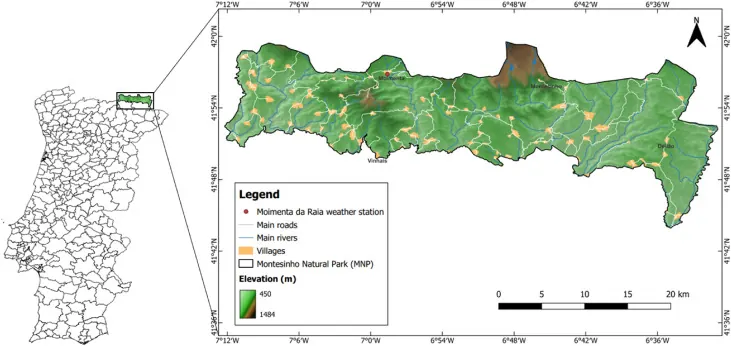
- Montesinho/Nogueira SAC, Portugal
41.850° N · 6.850° W - Scale
- landscape
Challenge
Field surveys tell you what is present now. They cannot tell a manager whether a landscape has been gaining or losing suitable habitat for the last two decades — and for which groups.
Data
- Satellite time-series (MODIS/Landsat-derived indices) from Google Earth Engine
- 10,190 species occurrence records across taxonomic groups
- Land surface temperature time-series for the mountain region
Intelligence
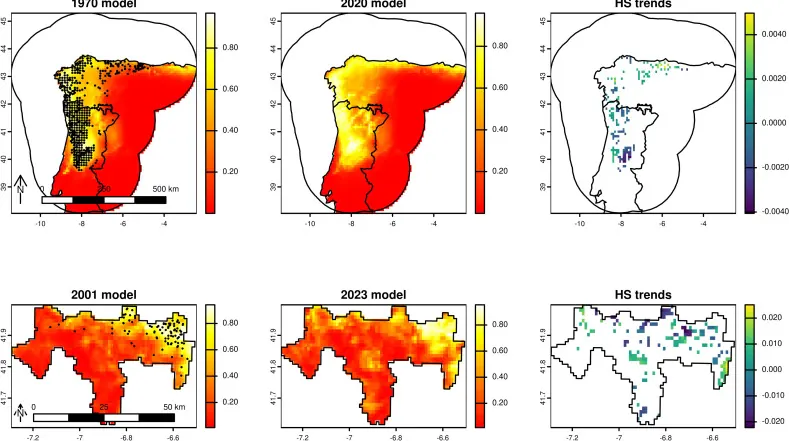
- Satellite-driven MaxEnt ecological niche models per taxon and year
- Potential species richness (PSR) surfaces and Mann–Kendall trend tests
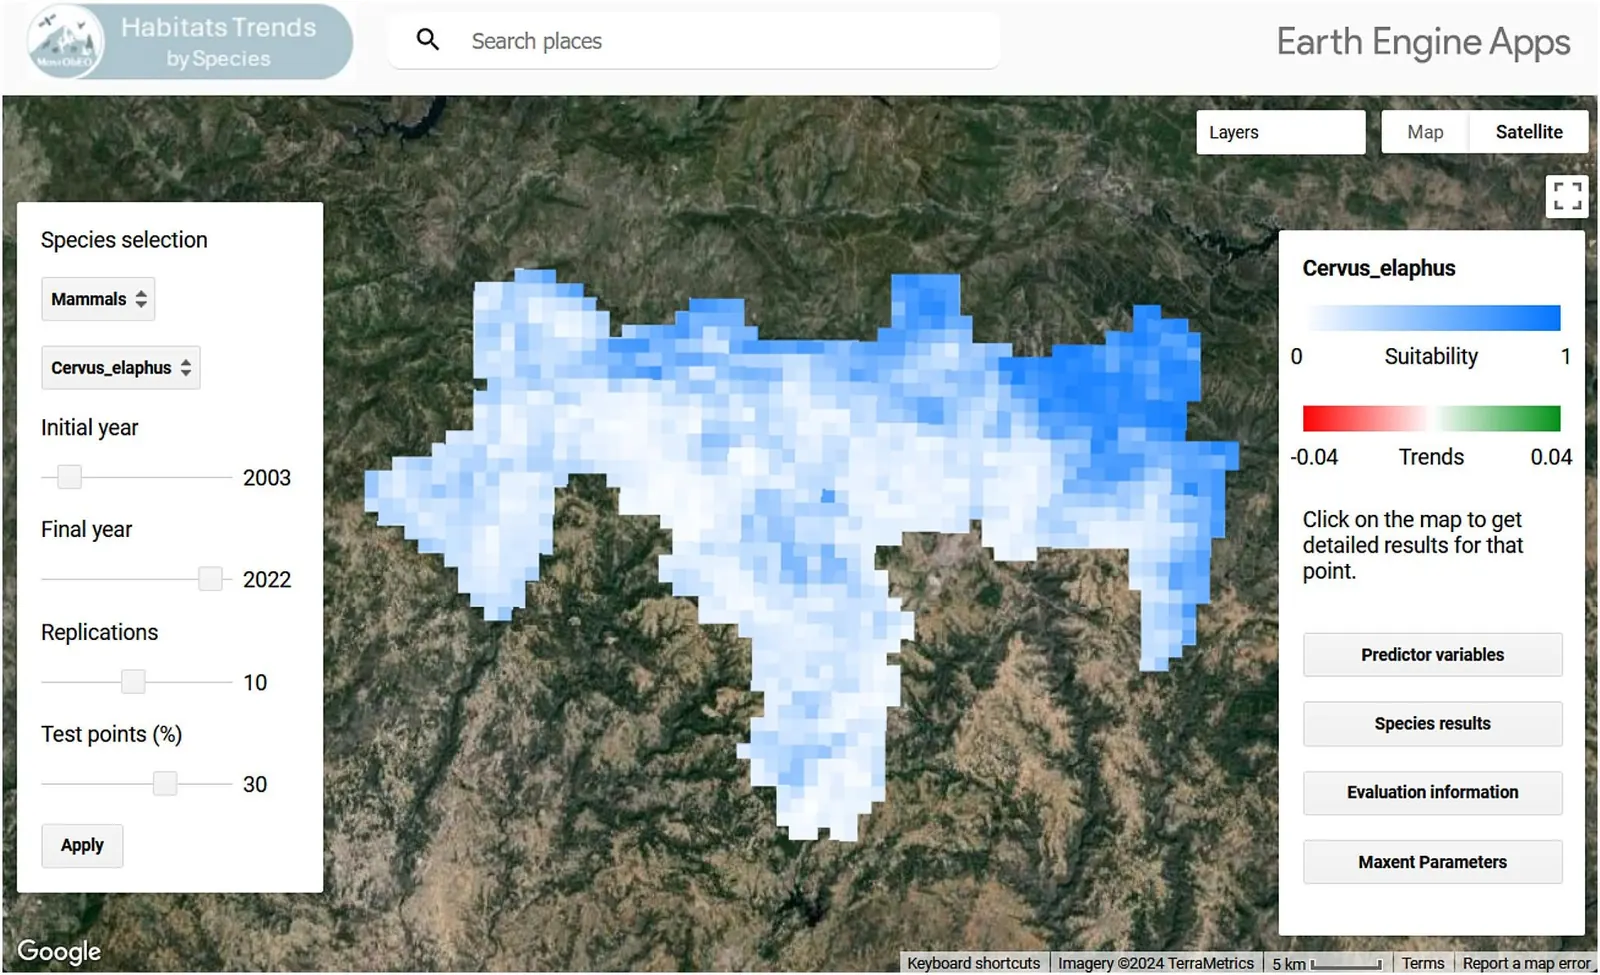
- Habitat-suitability trend indicators automated into a GEE application (Montrends) and an R package (Ecotrends)
Technology
- Google Earth Engine
- MaxEnt
- R
- Time-series analysis
- Spectral indices
Outcome
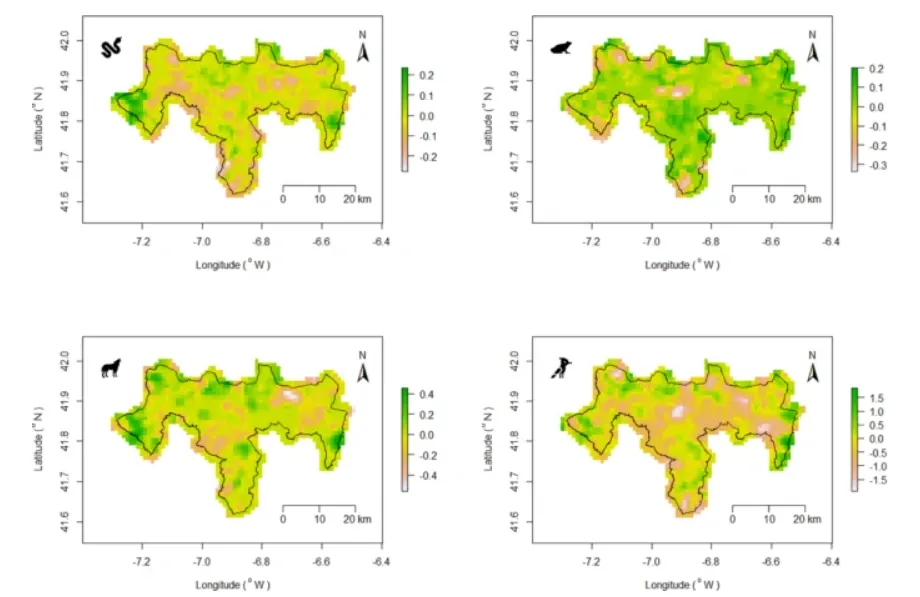
- Richness increased in eastern and western parts of the SAC and declined centrally — with taxon-specific trajectories
- A repeatable monitoring approach that runs in the cloud, not on a workstation
- Two reusable tools published for other researchers and practitioners
Why it was hard
Niche models are usually a snapshot. Turning them into a time-series means building one model per year with predictors that are comparable across two decades of sensors, then asking whether the differences are a trend or noise. Doing it in Google Earth Engine avoided downloading terabytes, but MaxEnt-in-GEE has its own quirks — which is why the earlier evaluation paper exists.
What it changed
Managers got a map of direction, not just state: which parts of the protected area are quietly losing habitat quality for which groups.
Visual evidence